TPA (Texture Profile Analysis)
One test returns hardness, springiness, cohesiveness and more — simulating human chewing.
Part 1
What is TPA (Texture Profile Analysis)
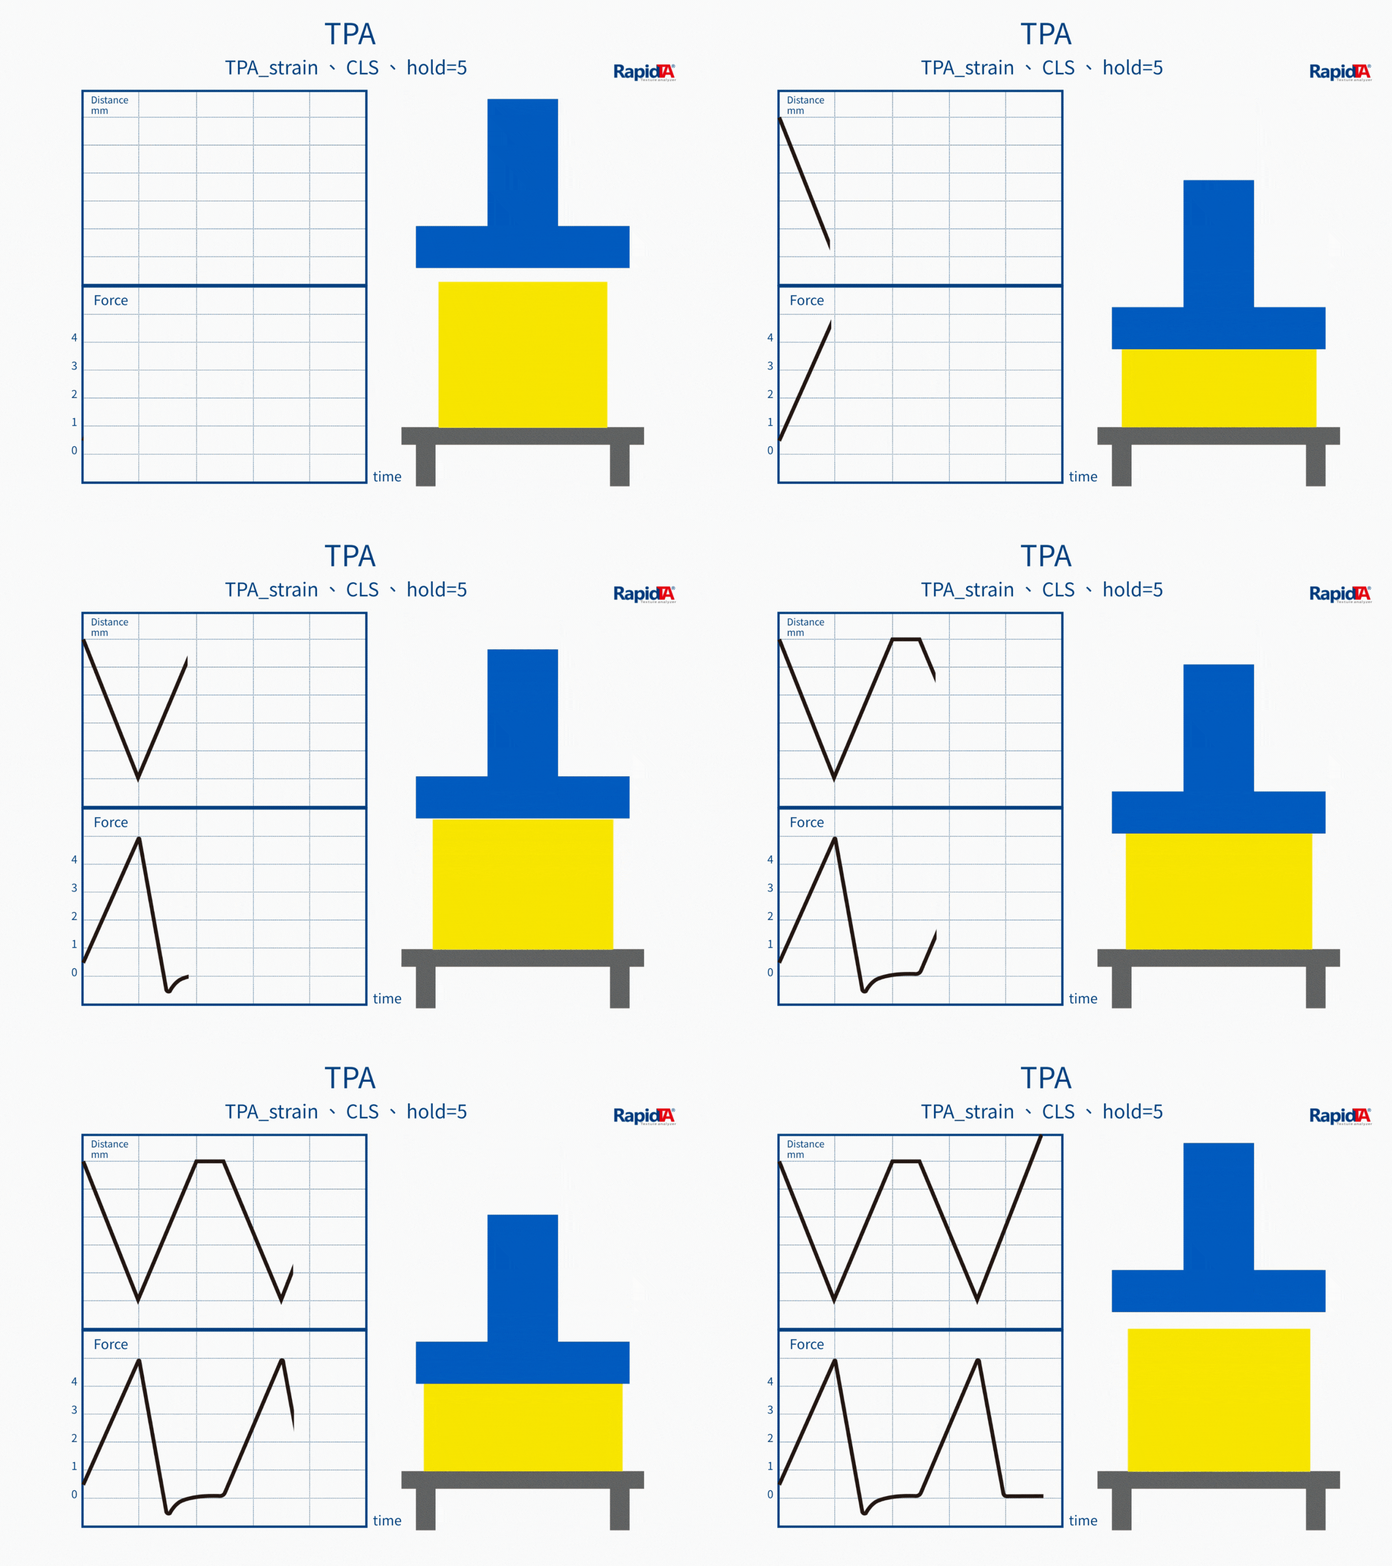
Texture Profile Analysis (TPA) uses a double-compression cycle on the texture analyzer to mimic human chewing, producing a complete texture profile of the food. A standardized TPA procedure returns 8–9 key texture parameters.
Application Domains
Texture Properties Measured
Technical Specifications
- Force range (by model)
- 500 – 20,000 gf / 500 – 50,000 gf
- Force resolution
- 0.1 gf
- Force accuracy
- reading 0.5% < error < full range 1%
- Stroke (by model)
- 100 / 200 / 350 mm
- Distance resolution / accuracy
- 0.001 mm / 0.1 %
- Speed range
- 0.025 – 10 mm/s (resolution 0.025 mm/s, accuracy 0.1 %)
- Data acquisition rate
- Up to 2000 points per second
- Software
- White collar (WC) / Blue collar (BC)
- Protection
- Emergency stop, force overload protection
Part 2
Principle & Operating Procedure
Principle
TPA runs a double-compression cycle with a TPA probe to mimic chewing. A sensitive load cell records the full force–time curve, and the texture parameters are calculated from the two bite segments.
Operating Procedure
First bite (Bite 1)
The probe moves down from the start point for the first compression.
Trigger and target
At the trigger point (set by trigger force) the system computes the target distance and presses to it.
Sample recovery
The probe returns to the trigger point and holds, depending on how fast the sample recovers.
Second bite (Bite 2)
After the hold, the probe presses again to the same target depth as the first bite.
Return and finish
The probe returns to the origin, completing one TPA cycle.
Part 3
Probe Selection & Characteristics
Probe and fixture choice strongly affects accuracy and repeatability. The probes and kits below are commonly used for this action — select one to see its samples.
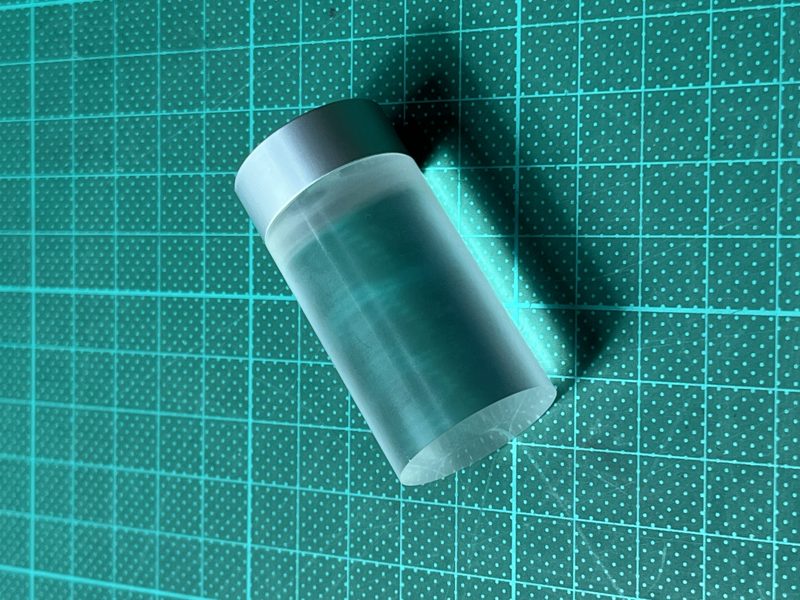
Cylindrical TPA probe
Ø 25 / 35 / 50 mm
Standard TPA for most foods, e.g. bakery and processed meat
Even force distribution, good repeatability
View probe & test kit →
Flat plate TPA probe
75 × 75 mm square plate
Thin sheets, biscuits, thin pastries
Large contact area, more stable data
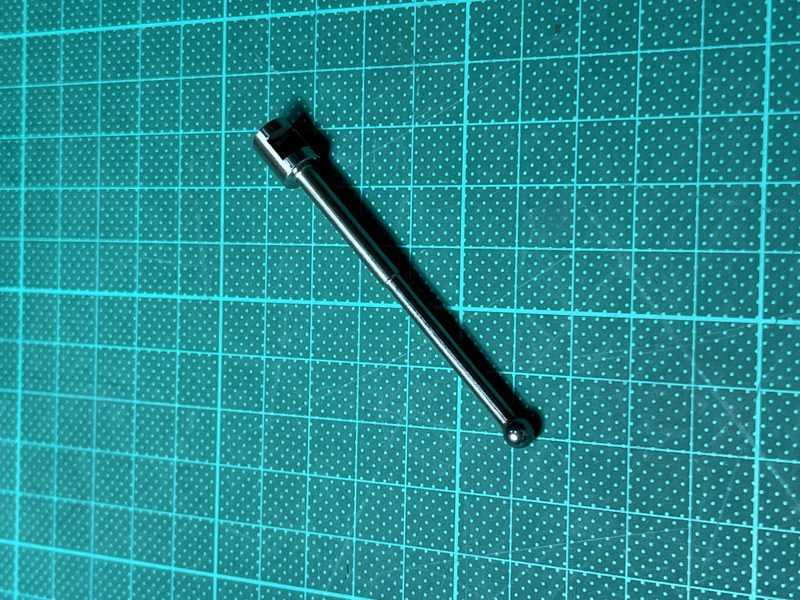
Spherical TPA probe
Ø 5 / 12.7 mm
Small or local tests: fruit, gels, soft candy
Point contact for local texture
View probe & test kit →
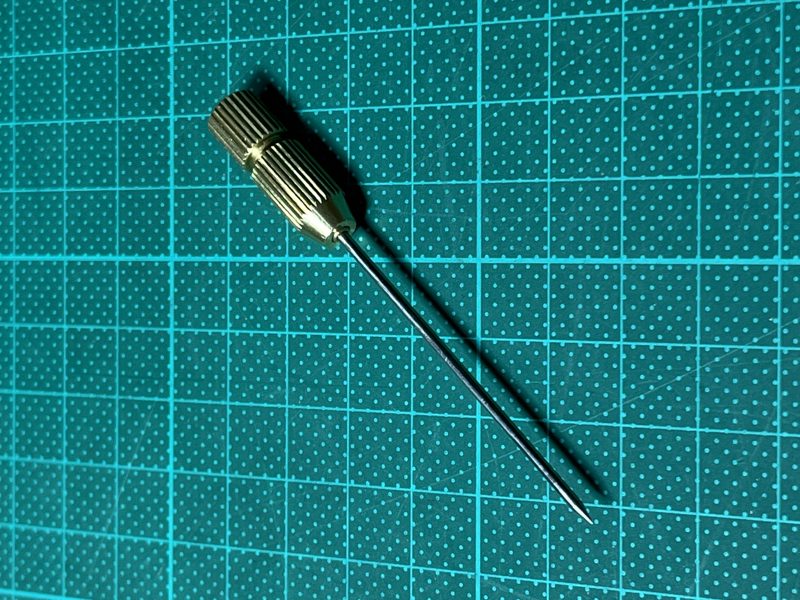
Needle TPA probe
Ø 2 mm, 50 mm long
Puncture: skin firmness or internal structure
Precise penetration for brittle analysis
View probe & test kit →
Part 4
Data Interpretation & Analysis
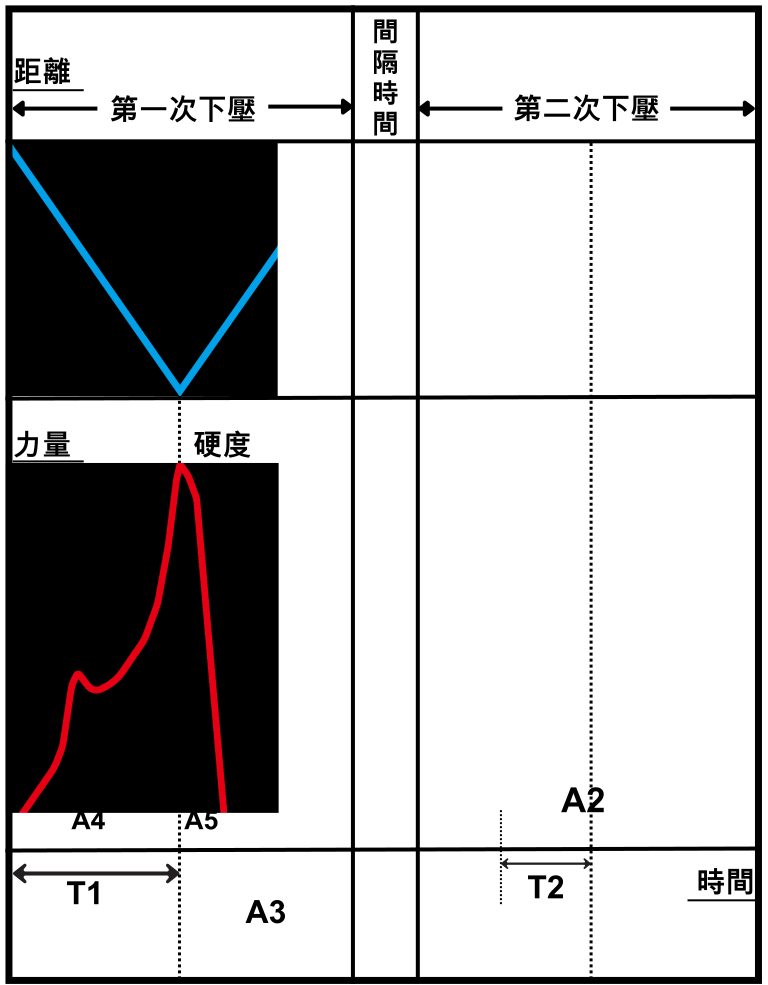
The TPA curve shows force across two compressions. A1–A5 mark the area intervals and T1–T2 the time interval; hardness, springiness, cohesiveness and other parameters are calculated automatically from these regions.
Test Curves & Diagrams

Parameters & Calculations
After a test, the software calculates these parameters from the curve
Hardness
Peak force in the first compression — the most direct indicator of mouthfeel.
Formula:Peak force in the first compression
Fracturability
A smaller peak before hardness, for samples with a crisp shell such as biscuits.
Formula:Smaller peak before hardness
Adhesiveness
Negative force as the probe retracts — the stickiness felt in the mouth.
Formula:Area A3
Springiness
How much the sample recovers between the first and second bite.
Formula:T2 / T1
Chewiness
Energy needed to chew a solid food — meat, rice cake, QQ candy.
Formula:Gumminess × Springiness
Gumminess
For semi-solid foods such as pudding, jelly and soft cheese.
Formula:Hardness × Cohesiveness
Cohesiveness
Ratio of the two compression areas — the internal structural integrity.
Formula:A2 / A1
Resilience
How fast and strongly the sample recovers after deformation.
Formula:A5 / A4
Part 5
Application Cases
Applicable Test Samples
These samples use this action — select one for the full test information
Part 6
Frequently Asked Questions
How do I choose a TPA probe?
Hard samples: small 25 mm probe to focus pressure. Soft samples: large 50 mm probe to spread pressure. Thin sheets: flat plate. Local tests: spherical or needle.
What are the TPA sample preparation requirements?
Samples 15–20 mm thick for room to deform; a flat surface for good probe contact; equilibrate to room temperature before testing; sample size at least twice the probe diameter.
How often should the analyzer be calibrated?
Monthly standard calibration with a reference block; a basic functional check before each day's tests; annual professional calibration for long-term stability.
How do I read a TPA test report?
The software outputs a graphical report with the raw curve, parameter table and statistics for the full texture profile.
What maintenance does the TPA system need?
Clean the probe and stage daily to remove residue; back up test data and parameter settings regularly. Good maintenance extends service life and keeps accuracy.
Related Test Actions
Compression Test
Measures mechanical response under compressive load — for hardness and springiness.
Learn More →
Puncture Test
Measures puncture resistance — surface hardness, fracturability and gel strength.
Learn More →
Tension / Extensibility Test
Pulls the sample vertically to measure extension and breaking force — extensibility and tensile strength.
Learn More →
Not sure which texture test method fits your product?
Feel free to share your testing needs anytime — we provide free test method recommendations, custom fixture selection, instrument model suggestions, and tailored quotes.